An overview of 2 Sample T Test
2 Sample T Test
![]() Sunil
May 28, 2019
3686
0
Sunil
May 28, 2019
3686
0


2 Sample T-Test
Summary
The two-sample t-confidence interval and test procedures are used to make inferences about the difference between two population means (A and B), based on data from two independent, random samples.
Suppose you have samples from two-grain dispensers and you wish to determine whether they are dispensing the same quantity. Or, you may have tread samples for two types of tires and wish to determine if they wear at the same rate.
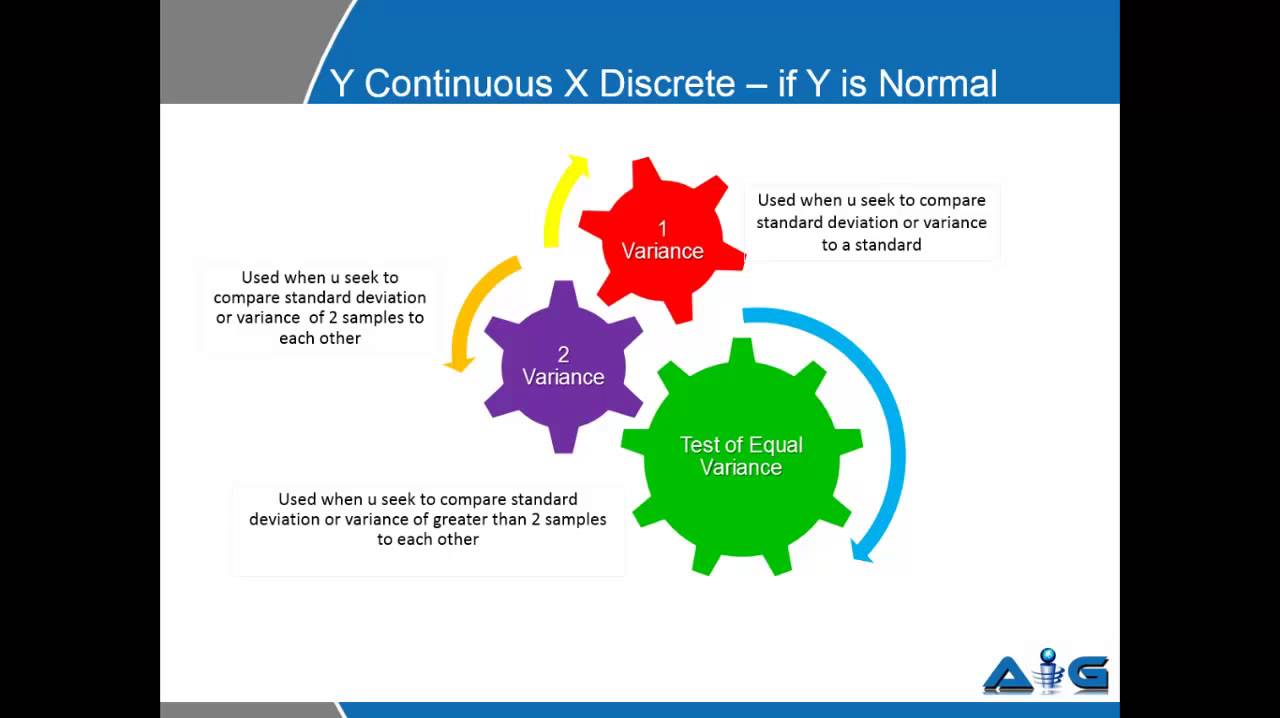
To use the two-sample t-procedures, your samples should be normally distributed. If your sample data do not appear to be normally distributed, you should consider using an appropriate non-parametric procedure. Also, the samples must be independent. If the samples are dependent or paired, use the paired t-test procedures instead.
Join Advance Innovation Group to develop the understanding of the implementation of Six Sigma within your area.
Hypothesis
When you use the two-sample t-procedures, you are really trying to decide which of two opposing hypotheses seem to be true, based on your sample data:
· H0 (the null hypothesis): That the difference, population mean of A and population mean of B, is equal to the chosen reference value (usually zero)
- or -
· H1 (the alternative hypothesis): That population mean of A and population mean of B is not equal to the chosen reference value. (By default, H1 is non-directional. However, a directional hypothesis can be specified instead.) Advance Innovation Group is the best institute in Delhi NCR where you can learn these concepts practically over the statistical tools by doing real-time projects.
Confidence Interval
The confidence interval is a range of likely values for the difference, between the population, mean of A and population mean of B. Since you do not know the true value of this difference, the confidence interval allows you to guess its value based on the sample data. The difference between sample means provides an estimate of the population mean of A and population mean of B, and the samples' standard deviations are used to determine how far off the estimate might be. In general, the proportion of intervals that include the population mean of A and population mean of B is equal to 1 minus the chosen alpha level. The alpha-level can be chosen as any value which is greater than 0% and less than 100%. The 0.05 alpha-level is commonly used.
Test
The t-test gives you two statistics that you can use to conduct a test of the difference between means: a t value and a p-value. The t-value is not very informative by itself, but it is used to determine the p-value. The p-value tells you just how likely it is that you would obtain your samples if H0 is true.
You must decide the p-value required to reject H0 before you conduct the test. The value that you choose as your criterion is called the alpha level. If the p-value is less than your a-level, then you reject H0 and conclude that population mean of A and population mean of B is not equal to the reference value. Advance Innovation Group is a proven name in the industry and has been able to train thousands of professionals over these concepts and help them achieve their dream job.


Comments (0)
Facebook Comments