Understanding ANOM
Understanding ANOM – Analysis of Means is beneficial for people using Anova as part of their analysis in Lean Six Sigma initiatives.
 Vinay Kumar
Apr 24, 2019
5225
0
Vinay Kumar
Apr 24, 2019
5225
0

Understanding ANOM – Analysis of Means
Understanding ANOM – Analysis of Means is very important for Six Sigma practitioners.
Use the ANOM interactions plot to test the hypothesis that there is no interaction between the factors in a two-way design at an a-level that you specify. The interactions plot shows the following:
- Plotted points – the effects for each cell in the two-way design. The effects indicate the strength of the interaction
- Reference line – plotted at zero.
- Lower and upper decision limits – used to test the hypothesis that each effect is equal to zero (that no interaction exists). Minitab looks for points located beyond the decision limits and marks them with a red symbol.
- If one or more effects are beyond the decision limits, then you reject the hypothesis and conclude that there is statistical evidence of an interaction. Examining which cells are beyond the decision limits may help you to interpret the interaction.
- If no effects are beyond the decision limits, then you cannot reject the hypothesis. There is no statistical evidence of an interaction.

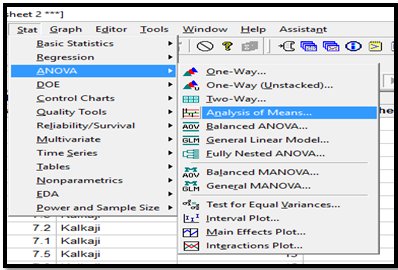
Analysis of Vairance – ANOM1
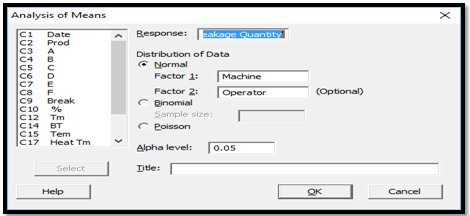
Analysis of Vairance – ANOM2
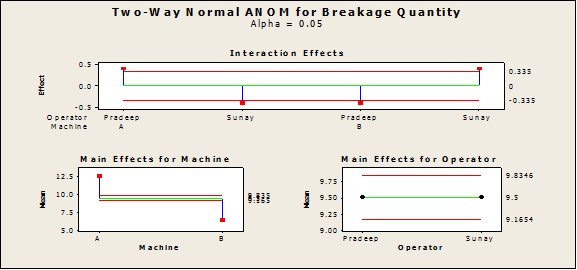
Analysis of Variance – ANOM3
Simply check values plotted vis-à-vis the red line (Decision line),if the value lies outside the decision line, ha shall be true else ho is true.
If you see above:
Points in the interaction graph is outside the decision line, hence you can conclude that Ha is true
Main effect for Machine also outside the decision line, hence Ha shall be true.
Main effect of the operator is inside the decision line, Ho is true.


Comments (0)
Facebook Comments