Stepwise Regression
Stepwise regression using Minitab removes and adds variables to the regression model for the purpose of identifying a useful subset of the predictors
 Vinay Kumar
Apr 24, 2019
6432
0
Vinay Kumar
Apr 24, 2019
6432
0


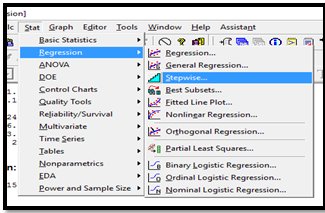
Stepwise Regression using MInitab shall be discussed through this article.
Stepwise regression removes and adds variables to the regression model for the purpose of identifying a useful subset of the predictors. Minitab provides three commonly used procedures:
- standard stepwise regression (adds and removes variables)
- forward selection (adds variables)
- backwards elimination (removes variables)
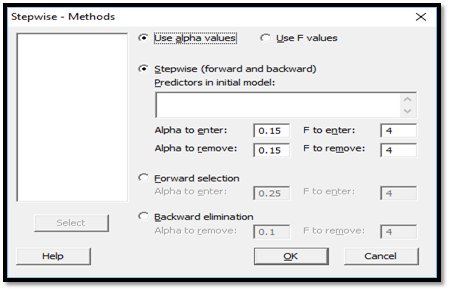
Stepwise regression is a procedure that generates a model by including variables in or excluding variables from the model based on the specified Alpha-to-Enter and Alpha-to-Remove values. The stepwise information table consists of:
- Alpha-to-Enter, which is the value that determines if any of the predictors not currently in the model should be added to the model.
- Alpha-to-Remove, which is the value that determines if any of the predictors in the model should be removed from the model.
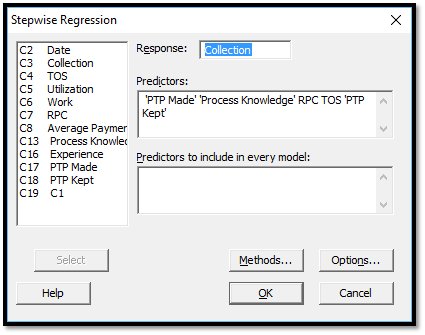
- Summary line, which includes the response name, the number of independent variables or predictors considered, and the number of observations used in the analysis.
This table displays the stepwise model selection results at each step based on the alpha-to-enter value. The table includes the coefficient, t-value, and p-value for the included predictors. The p-values are used to determine whether the predictor is entered or removed from the model.
The stepwise Regression table includes statistics that can be used for model selection. The statistics include:
- S estimates the standard deviation of the error term in the model. In general, the smaller the S, the better the model fits the data.
- R-Sq is the proportion of the variation in the response data explained by the model. The larger the R , the better the model fits the data.
- R-Sq(adj)is a modified R that has been adjusted for the number of terms in the model.
- Mallows’ Cp is another statistic for assessing how well the model fits the data. Mallows’ Cp should be close to the number of predictors contained in the model plus the constant. Using Mallows’ Cp to compare regression models is only valid when you start with the same set of variables.
- PRESS is the sum of squares of the prediction errors. In general, the smaller the PRESS, the better the model predicts data.
- R-sq(pred) is another R -like statistic that reflects how well the model will predict future data.
Use these statistics to compare how well the model fits the data at each step.
Stepwise Refression1
stepwiseregression_2
stepwiseregression_3
The output you shall receive
Stepwise Regression: Collection versus PTP Made, Process Knowledge, …
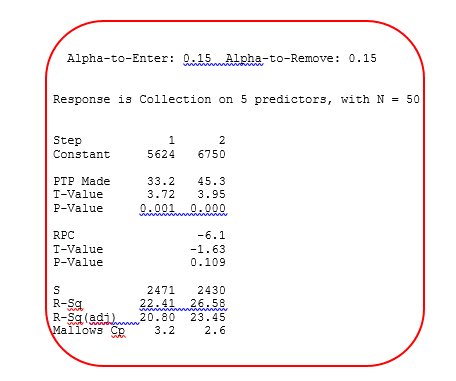
Step wise Regression result window
For the example, Alpha-to-Enter and Alpha-to-Remove are 0.15.
Thus, at each step of the procedure, a factor is added to the model, because it has the smallest p-value among those predictors with p-values less than 0.15.
Similarly, at each sequential step of the procedure, a predictor is only removed from the model if it has the largest p-value among those predictors with p-values greater than 0.15.
For the data used, the response is Collections, and there are 4 predictors and 10 cases.
At the first stage, PTP Made has the lowest p value, at the second step, RPC is taken as it has p value less than 0.15.
No variable is further taken as they may have p value > 0.15


Comments (0)
Facebook Comments