7 years ago

This article is published by Advance Innovation Group for Six Sigma practioners...

Understanding Control Charts constitute an important part of Statistical Process...
Understanding Graphical Summary. Graphical Summary provides an excellent way to...
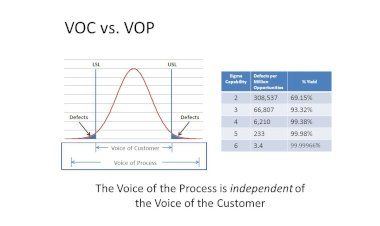
VOC vs VOP. VOC generally means the Voice of Customer. It is a representation of...
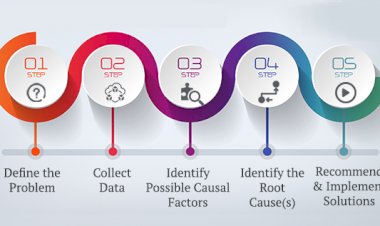
Understanding 5 Why Analysis is a very simple and yet a powerful tool which helps...
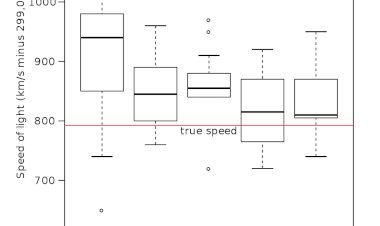
Box plot are typically provided as output from statistical packages such as Minitab...

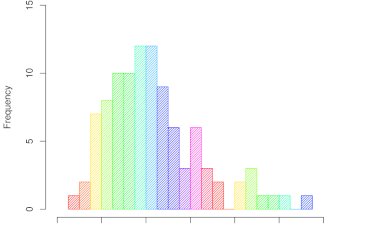
Dot-plot are typically used for data sets with fewer than 30 to 50 points. Larger...
This article is published by Advance Innovation Group for Six Sigma practioners...

This video is prepared by Advance Innovation Group for Six Sigma practioners to...
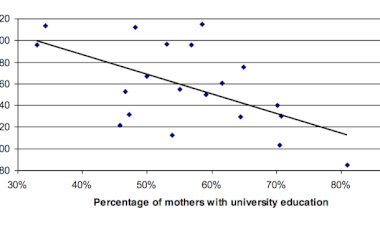
Scatter diagram are graphical tools that attempt to depict the influence that one...
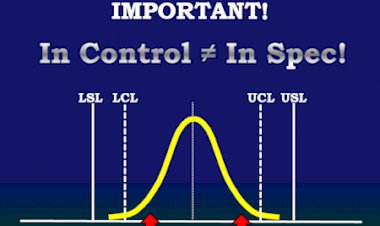
This article upon Relationship Control Limit Specification Limit is posted to have...
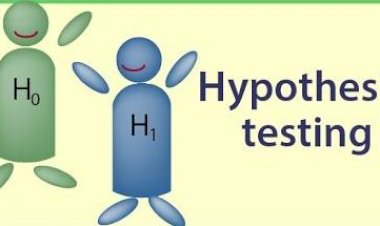
Hypothesis testing is the process of using a variety of statistical tools to analyze...
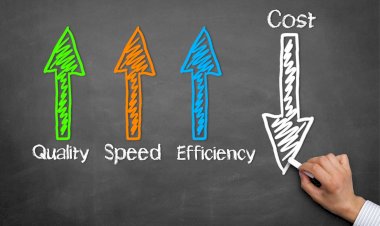
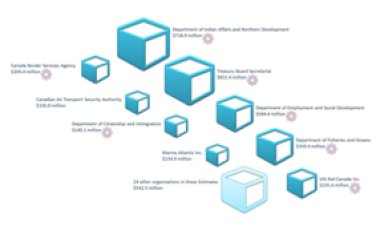
3 Simple Steps to Reduce Operations Cost in Your Business are detailed in this article...
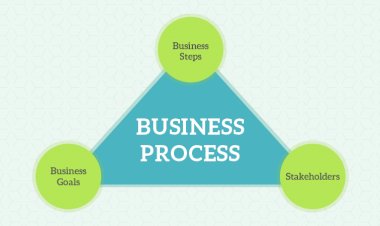
What’s the Starting Point Improving Processes in any company is discussed from the...