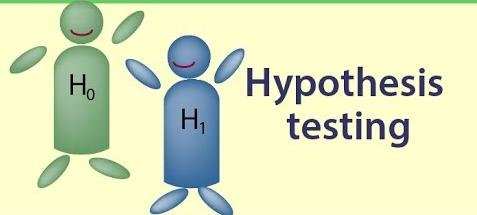
Hypothesis Testing
Hypothesis testing is the process of using a variety of statistical tools to analyze data and, ultimately, to accept or reject the null hypothesis.

Hypothesis testing is the process of using a variety of statistical tools to analyze data and, ultimately, to accept or reject the null hypothesis.
Hypothesis Testing
Hypothesis testing refers to the process of using statistical analysis to determine if the observed differences between two or more samples are due to random chance (as stated in the null hypothesis) or to true differences in the samples (as stated in the alternate hypothesis). A null hypothesis (H0) is a stated assumption that there is no difference in parameters (mean, variance, DPMO) for two or more populations. The alternate hypothesis (Ha) is a statement that the observed difference or relationship between two populations is real and not the result of chance or an error in sampling. Hypothesis testing is the process of using a variety of statistical tools to analyze data and, ultimately, to accept or reject the null hypothesis. From a practical point of view, finding statistical evidence that the null hypothesis is false allows you to reject the null hypothesis and accept the alternate hypothesis.
Null Hypothesis:
A null hypothesis (H0) is a stated assumption that there is no difference in parameters (mean, variance, DPMO) for two or more populations. According to the null hypothesis, any observed difference in samples is due to chance or sampling error. It is written mathematically as follows: H0: m1 = m2 H0: s1 = s2. Defines what you expect to observe. (e.g., all means are same or independent). (P > 0.05)
Alternate Hypothesis:
The alternate hypothesis (Ha) is a statement that the observed difference or relationship between two populations is real and not due to chance or sampling error. The alternate hypothesis is the opposite of the null hypothesis (P < 0.05). A dependency exists between two or more factors
P-Value:
The p-value represents the probability of concluding (incorrectly) that there is a difference in your samples when no true difference exists. It is a statistic calculated by comparing the distribution of given sample data and an expected distribution (normal, F, t, etc.) and is dependent upon the statistical test being performed. For example, if two samples are being compared in a t-test, a p-value of 0.05 means that there is only 5% chance of arriving at the calculated t value if the samples were not different (from the same population). In other words, a p-value of 0.05 means there is only a 5% chance that you would be wrong in concluding the populations are different. P-value < 0.05 = safe to conclude there’s a difference. P-value = risk of wasting time investigating further.
P.S. Statistically speaking:
The statistical significance of a result is the probability that the observed relationship (e.g., between variables) or a difference (e.g., between means) in a sample occurred by pure chance (“luck of the draw”), and that in the population from which the sample was drawn, no such relationship or differences exist. Using less technical terms, one could say that the statistical significance of a result tells us something about the degree to which the result is “true” (in the sense of being “representative of the population”). More technically, the value of the p-value represents a decreasing index of the reliability of a result (see Brownlee, 1960). The higher the p-value, the less we can believe that the observed relation between variables in the sample is a reliable indicator of the relation between the respective variables in the population. Specifically, the p-value represents the probability of error that is involved in accepting our observed result as valid, that is, as “representative of the population.” For example, a p-value of .05 (i.e., 1/20) indicates that there is a 5% probability that the relation between the variables found in our sample is a “fluke.” In other words, assuming that in the population there was no relation between those variables whatsoever, and we were repeating experiments like ours one after another, we could expect that approximately in every 20 replications of the experiment there would be one in which the relation between the variables in question would be equal or stronger than in ours. (Note that this is not the same as saying that, given that there IS a relationship between the variables, we can expect to replicate the results 5% of the time or 95% of the time; when there is a relationship between the variables in the population, the probability of replicating the study and finding that relationship is related to the statistical power of the design. See also, Power Analysis). In many areas of research, the p-value of .05 is customarily treated as a “border-line acceptable” error level.
Comparing Two Situations – Asking “Are they different?”
Ho: Null Hypothesis – There is no difference
Ha: Alternate Hypothesis – There is a difference
Hypothesis Testing
2 thoughts on “Hypothesis Testing”

 Pankaj Kumar


Comments (0)
Facebook Comments