Dot-Plot
Dot-plot are typically used for data sets with fewer than 30 to 50 points. Larger data sets use histograms and box plots for same.
 Pankaj Kumar
Apr 24, 2019
4017
0
Pankaj Kumar
Apr 24, 2019
4017
0

Dot plots are typically used for data sets with fewer than 30 to 50 points. Larger data sets use histograms and box plots
Dot plot:
Dot plots display a dot (or other mark) for each observation along a number line. If there are multiple occurrences of an observation, or if observations are too close together, then dots will be stacked vertically.
– Dot plots are very easy to construct by hand, so they can be used “in the field” for relatively small sets of data.
– Dot plots are typically used for data sets with fewer than 30 to 50 points. Larger data sets use histograms and box plots
Unlike histograms, dot plots show you how often specific values occur.
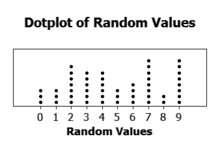
Dot plot – Sample:
Dot-Plot


Comments (0)
Facebook Comments