Introduction to Hypothesis Testing Concepts
This article on Introduction to Hypothesis Testing Concepts shall be helpful for Lean Six Sigma practitioners understand Hypothesis Concepts
 Vinay Kumar
Apr 24, 2019
2761
0
Vinay Kumar
Apr 24, 2019
2761
0

This article on Introduction to Hypothesis Testing Concepts shall be helpful for Lean Six Sigma practitioners understand Hypothesis Concepts
Hypothesis Test
Introduction to Hypothesis Testing Concepts shall help get a basic view of the useful terms used in Hypothesis.
Hypothesis Testing can be understood as statistical technique of making inference about population on the basis of sample. The technique is similar to taking a spoon of soup from bowl and tasting it, and on the basis of taste perceived in spoon soup making inference on the taste of soup in entire pot. The only difference in hypothesis test would be that it is more based on data/ facts and not on perception. Hypothesis test always starts with sample and ends with inference on population.
Population in statistics refers to entire data of interest. What we must understand about population is, it is dynamic in nature. Population always keeps changing and is not static. If talk about call handling time of a BPO process that has been running for last three months, then one may say that I have entire data of population on a specific date. But for very next day that data of three months will no longer be population. Because even one new call taken after that date has changed the entire data of interest i.e. your population has changed. And now the data that you have just is a sample. Sample is a subset of population. Any data that we will be using in our daily life, we will be treating that as sample and not as population.
Null and Alternate Hypothesis
In any statistical analysis (hypothesis testing) there can only be two outcomes. One of these outcomes is commonly referred as Null Hypothesis and is denoted as Ho and another outcome is commonly referred as Alternate hypothesis and is denoted as Ha.
Alternate hypothesis at times is also called researchers hypothesis, as this is the hypothesis that the researcher wants to prove. Null hypothesis is default/ prevailing assumption that need not to be proved. The best way to understand these hypotheses is by taking example of court room trail. As a jury, in any court room trail, the default assumption you will have about accused is that he is innocent unless he is proved guilty. So the Null hypothesis here is that “Accused is Innocent”. In this case you will have to prove that he is guilty, so Alternate hypothesis would be that “Accused is Guilty”. In Hypothesis testing we never prove Ho; rather we always try to prove Ha. Failure to prove Ha will obviously mean acceptance of Ho.
Ho: – X does not have significant impact on Y
Ha: – X has significant impact on Y
We decide on whether should we accept Ha or should we reject Ha (i.e. accept Ho) on the basis of something called P-value (Value of Significance)
P-Value (Value of Significance)
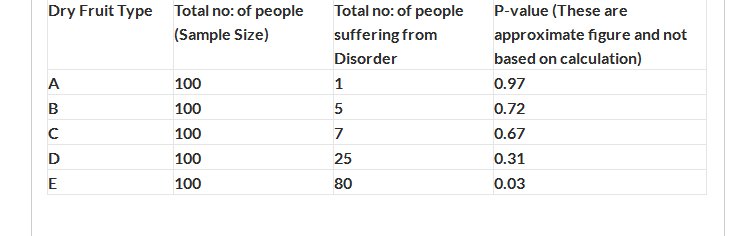
Let’s understand P-value by one example. We want to check if consuming more than 100g of certain dry fruit causes digestion related health issues or not. Now, what we must understand is, digestion related health issues may arise due to hundreds of other reasons (apart from the specific dry fruit). We use word “chance” to represent impact of those hundreds of other reasons (apart from the specific dry fruit). “P-value is the probability that what you have observed in sample exists purely by chance”.
We have used 5 different types of dry fruits on different group of people for a week, and we recorded no: of people who suffered from digestion related disorder.
Let’s look at result obtained for dry fruit type “A”, just 1 out of 100 people have had digestion related issues. The probability that this disorder may be because of chance (and not because of dry fruit A) is higher. Our table shows P-value as 0.97 i.e. 97% probability that observed relationship (1 digestion related issue in 100 due to dry fruit type A) exist purely by chance and no such relationship exist in population. As we go down in table we see digestion related issues are increasing. Increase in digestion related issues (after consuming dry fruit) is reducing the contribution of chance. In dry fruit E, 80 out of 100 people have had digestion related issue. 80 out of 100 people can’t simply have digestion related issues simply by chance, here probability of “what we have observe is a chance” is low i.e. 0.03. Lower P-value shows lower probability that what you observe could happen by chance i.e. there is high probability that dry fruit has strong relation with digestive issues. Higher P-value shows higher contribution of chance and in such cases we would avoid going with Ha (i.e. there is significant relation between dry fruit and digestive issues.
Thumb Rule: – lower the P-value you will tend to go with Ha. Higher the P-value you will tend to with Ho.
Alpha Value (level of Significance)
We know that lower the P-value we tend to go with Ha, higher the P-value we tend to go with Ho. Now the question comes what is the threshold value for P that would decide whether we should go with Ha or Ho. This threshold value for P is called alpha value. Cases where P-value is smaller than alpha value, we tend to go with Ha. Inversely when P-value is greater than alpha value, we would prefer going with Ho. Market standard for alpha value is 0.05 however it can be changed as per the need to experiment.
Confidence Interval
In Hypothesis test we always study sample and make inference about population. We all have sample data, but we hardly have population data in our real life (as all population data will become sample after some time). We can easily calculate sample statistics (mean, median, std dev. etc. of sample) as we have sample data available with us. But we cannot directly calculate population parameter (i.e. mean, median, std dev. etc. of population) as we hardly have complete data of population. We however, have some statistical concepts that can easily help us compute population parameter on the basis of sample. When we compute population parameter on the basis of sample, we get a range of values and these ranges of values are called Confidence Interval (CI).
“CI is the range of values calculated from sample statistics that is likely to include population parameter at a given level of confidence”.


Comments (0)
Facebook Comments