How to create A factorial design in Minitab:-3
How to create A factorial design in Minitab:-1 in Design of Experiment- This Article will help you to understand the particle use of A factorial Design.
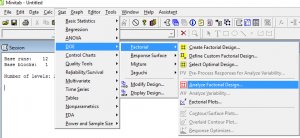
When you analyse an experiment, you are actually fitting a model to the data. You estimate the effects of main factors and interaction terms. Here, you can choose how high of an interaction term you want to estimate.
With the reference of
Page-1 https://www.advanceinnovationgroup.com/blog/6025-2/
Page-2 https://www.advanceinnovationgroup.com/blog/create-factorial-design-minitab-2/
Analysing Factorial Design

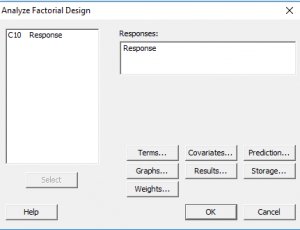
When you analyse an experiment, you are actually fitting a model to the data. You estimate the effects of main factors and interaction terms. Here, you can choose how high of an interaction term you want to estimate.
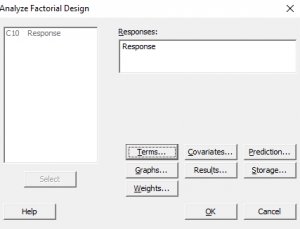
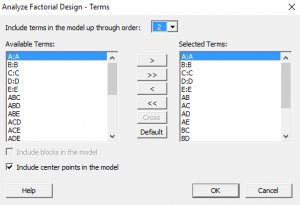
Selected Terms are the main factor/interaction effects that will be estimated. Available Terms are other interaction terms that are not being estimated (but could be). You can pick and choose specific effects to
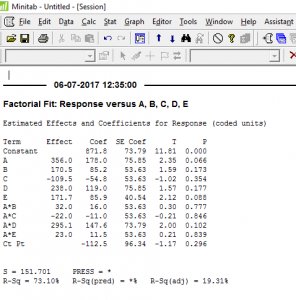
We can find the Effect Estimates. We can also look at R-sq. values and residuals to determine how well the model fits. See Regression Analysis for an explanation on how to interpret residuals
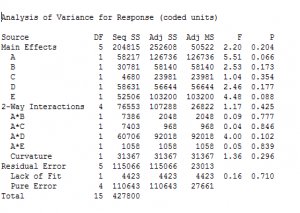
The p-values < 0.05 indicate significant curvature. But p-value>0.05, indicates no significant curvature.
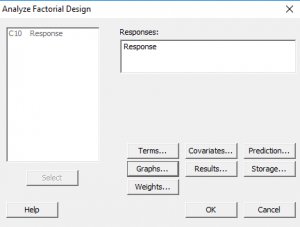
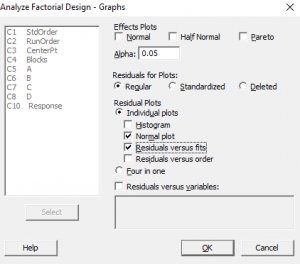
Then, we go to graph and Normality plot and Residuals versus fits Plot
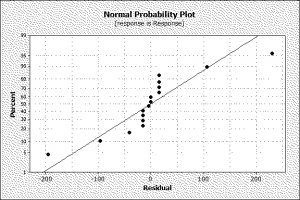
We can find out that it is a non-normal data
Create the Factorial Plots
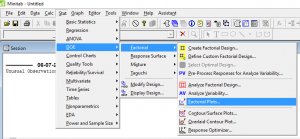
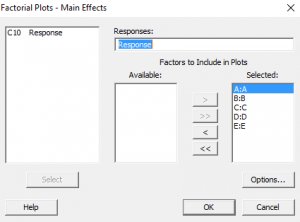


You can see factor A is moving from low to high.

We can find out the potential impacts from this interaction plot.

 Vinay Kumar




Comments (0)
Facebook Comments