Articles
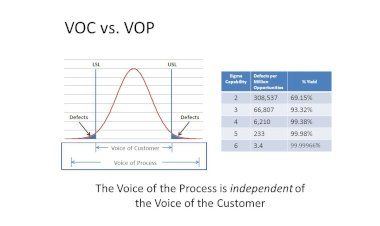
Understanding Graphical Summary
Understanding Graphical Summary. Graphical Summary provides an excellent way to...

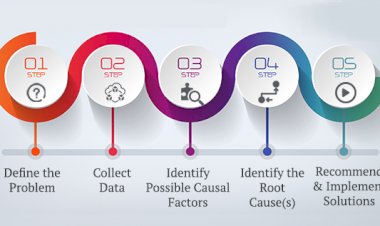
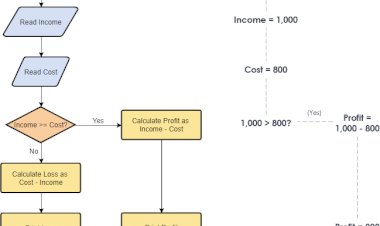
Understanding 5 Why Analysis
Understanding 5 Why Analysis is a very simple and yet a powerful tool which helps...
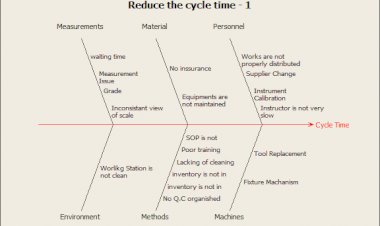
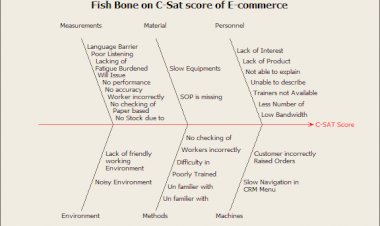
Fishbone on Cycle Time
This project is created by advance Innovation group the topic fish bone cycle time...

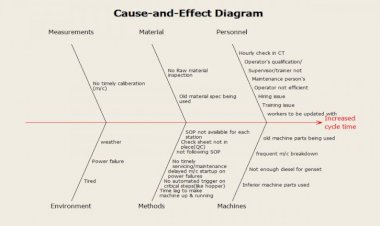
Cycle Time Fishbone
Cycle time fishbone analysis is prepared for understanding potential causes for...
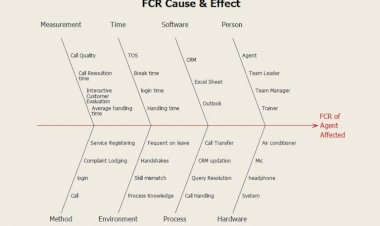
Fishbone on FCR
I have commenced project increase FCR in BPO. Can you help me out to identify the...

What is Design of Experiment
Design of experiment is very useful to identify the new causes who are impacting...
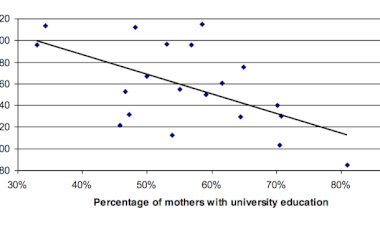
Scatter Diagram
Scatter diagram are graphical tools that attempt to depict the influence that one...

Working Overtime? Are You Producing WASTE or VALUE?
Apply Lean techniques to reduce or eliminate wastes like:- Waiting for someone/something...
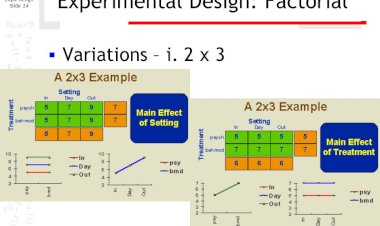
WHEN DO YOU USE A FACTORIAL DESIGN?
Factorial designs are good preliminary experiments. This article will help you to...