Ppk : Lesser known sibling of Cpk
Ppk : Lesser known sibling of Cpk
 Pankaj Kumar
Apr 24, 2019
6369
0
Pankaj Kumar
Apr 24, 2019
6369
0

Ppk : Lesser known sibling of Cpk
Ppk : Lesser known sibling of Cpk
Cpk and Ppk are indices for measurement of process capability
while Cpk is measure of Potential process capability
i.e. how well your process can perform under best conditions
Ppk is indices of actual process performance
So if a process has a Cpk of 1.5 and Ppk of 0.67
it is evident that process is producing defectives .
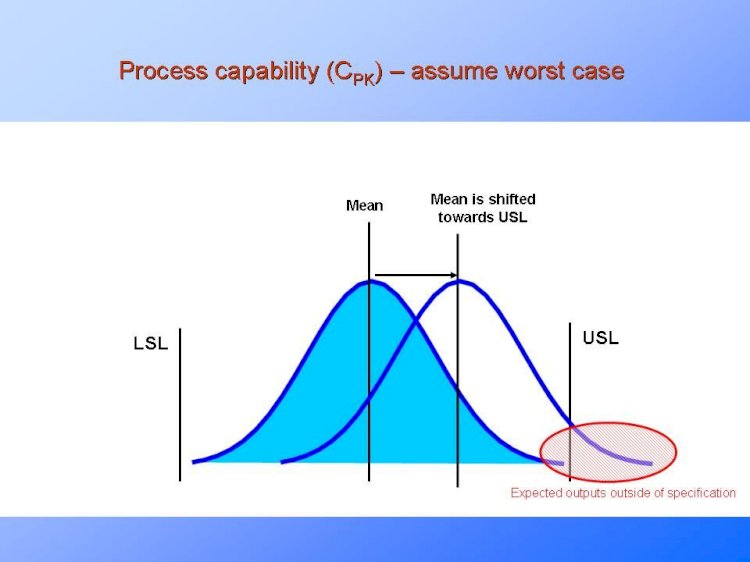
How Cpk and Ppk are calculated
Cpk = minimum of (Cpu , Cpl) or minimum of (( USL-Mean)/3sigma , (Mean- LSL)/3 sigma))
The value of sigma is calculated from R bar chart
sigma = (R bar/d2)
R bar is the average range from R bar chart and d2 is a constant from empirical table
R bar is average of range of all the subbgroups
if range is small , so will be R bar and consequently sigma will be small
which translates to high value of Cpk .
Ppk = minimum of (Ppu , Ppl) or minimum of (( USL-Mean)/3s , (Mean- LSL)/3s))
Here sigma is replaced by s
“s” is overall standard deviation which is calculated across all the data .
If value of s is high , then value of Ppk will be low ,which spells disaster for process
For the proces to be in real staistical control
intra subgroup varition and inter subgroup variation has to be same
i.e. Cpk and Ppk are more or less same
At the end if the process is not in statistical control then Cpk,Ppk are pointless
The process has to be brought under statistical control
and easy way to do that is to look at your control chart


Comments (0)
Facebook Comments