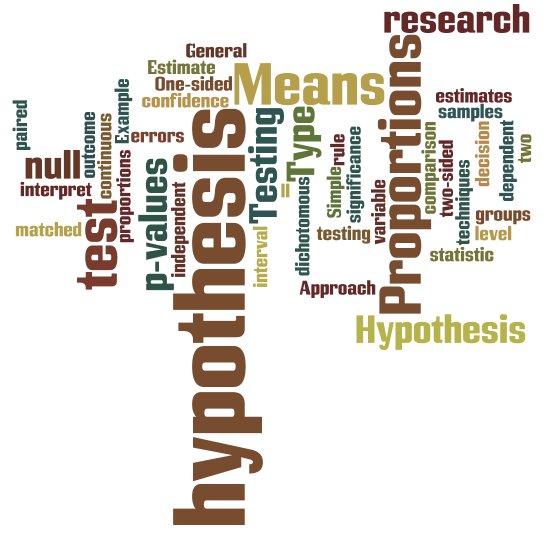
Proportion Based Hypothesis Testing
Proportion Based Hypothesis Testing
 Pankaj Kumar
Apr 24, 2019
2297
0
Pankaj Kumar
Apr 24, 2019
2297
0

Proportion Based Hypothesis Testing
Proportion is a representation of a ratio in which numerator value is part of the denominator. In another words, we can say that it is presentation of a part of percentage out of the total sum. In statistical terms, it can also be called as a representation of a sample out of the population data.
Proportion based tests are used to check the proportion of the data which is performing as per the expectations. A proportion of sample data is taken to check this and based on this, Confidence Interval of the whole population is formulated. Proportion is the best parameter to check if the data to be checked is categorical, preferably binary data.
Proportion based hypothesis testing for sample data is done to statistically validate either of the following scenarios:
• To know the Confidence Interval in which the population proportion is expected to lie
• If the proportion value of the sample data is equal to the standard or target
• If the proportion value of two population is equal or not.
Based on these, it is statistically validated if the null hypothesis is true or the alternate hypothesis is true.
Type of Proportion based tests
1. 1 Proportion Test: Sometimes, it so happens that observations in a population can be categorized in one or two groups. 1 Proportion test is used to check the proportion of the population against a standard or target value. It is generally used when the y is discreet and categorical (in binary form) and x is continuous. It is also used for base lining of the process by calculating the proportion of sample and getting a Confidence Interval of upper and lower value where the proportion of the entire population lies, with 95% probability.
Minitab Navigation -> Stat – Basic Stats – 1 Proportion
2. 2 Proportion Test: It is a proportion based test where data of two sub-groups or population are used to make a comparison of proportions. The data is usually present in binary form such as Accept or Reject, Pass or Fail, Target met or Target not met, etc. The data of both sub-groups or populations must be independent. The resultant output shows if the proportion of both populations and sub-groups is different or not.
Minitab Navigation -> Stat – Basic Stats – 2 Proportion


Comments (0)
Facebook Comments