Z Score Calculation
Z Score Calculation in Six Sigma Projects or outside is an imperative excercise in Lean Six Sigma Projects and in certain dashboards
 Vinay Kumar
Apr 24, 2019
15018
0
Vinay Kumar
Apr 24, 2019
15018
0


The Z-score Calculation
Z Score Calculation is a important aspect of six sigma projects
Also Z is one of the common yardsticks for measuring process capability is a Z-score.
Z-score can be understood as number of standard deviation that fits between specification limit and the mean.
One of the common challenges that every business faces is, they have different processes in their organization and definition of defects for all the process differs. For example, in finance, defect may be any vendor payment that is delayed by 10 days. In Account receivable, defect may be any AR that is not realized within 20 days. In sales defect may be any advisor having monthly sale smaller than Rs 200,000. In operation any month when quality score of the process is below 95%. Now comparing performance of these all process becomes very difficult as defects are expressed in different units. Z- Serves as common yardstick that can help us compare performance of all these processes. Using Z we may know which of our process is performing better and where we need to focus more.
Z is calculated as
Formulate for calculating Z Score for Business Processes
Be sure that the process is stable and that it exhibits only random variation around a center.
Calculating Z Score for 1 Sided Specification limit
Should you have only one sided specification (either USL or LSL) you can use the below:
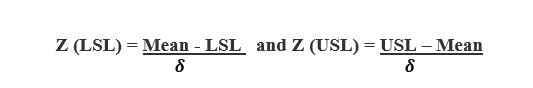
Formulate for calculating Z Score for Business Processes
Let us understand through examples:
When only USL is available
Assume you work with Pizza Delivery Unit and you have promised to supply pizza to the customer is 30 Minutes. Anytime you take greater than 30 minutes, you have agreed to give the pizza for free.
Should you look at calculating the Z Score for this process, follow the steps below:
- Decide if specification is USL or LSL, in this case it is USL (Going beyond 30 shall be termed as defect)
- Calculate the mean and standard deviation of the data of Delivery TAT
Let us assume that the Mean = 28 Min and Std Dev is 2 Min
Use the formulae
Z (USL) = (USL – Mean)/Std Dev
Z (USL) = 30 – 28/2 = 1
In the above example as we have only 1 Sided specification, we shall consider the Z (USL) as the Z Score of the Process
When only LSL is available
If we @AIG were to look at the process capability of Student Exam Score which has a passing percentage of 60 (LSL)
We calculated the mean of the process and found it to be 80, with std deviation of 5
Use the formulae
Z (LSL) = (Mean – LSL)/Std Dev
Z (LSL) = (80 – 60)/5 = 4
In this example as there is just one-sided specification i.e. the LSL, Z (LSL) shall be considered as the Z Score of the Process
When both sided specification is available
Should you have both sided specifications available e.g. if we are under contractual obligation to deliver cloth between 140 cm & 120 cm. Customer has mandated that cloth greater than 140 shall not be acceptable and less than 120 is not acceptable.
- As in the above examples, first steps shall be to calculate mean & standard deviation of the produced cloth Let us assume that the calculated mean is 130 with standard deviation of 10
- Define the USL & LSL of the process. In this case USL is 140 cm and LSL is 120 cm
- Using the same formulae of Z (USL) & Z (LSL) calculate the value
Z (USL) = USL – Mean/Std Dev
= 140 – 130 / 10
= 1
Z(LSL) = Mean – LSL /Std Dev
= 130 – 120/10
= 1
Once the Z Score of both sides are calculated, the next step would be to refer to the Z Table and find the DPO Score for Z Scores of the sides.
If you were to refer to the Z Table for Z Score of 1 you would get the DPO of 1.59 e-001. See the Screen Shot of the Z Table below.
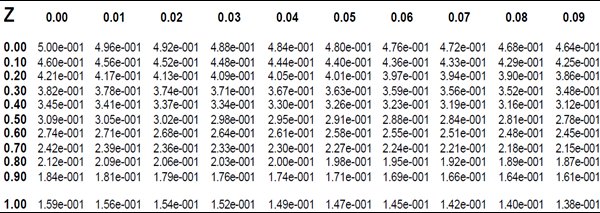 Z Table Screenshot
DPO (USL) = 1.59 e-001 (remember this mathematically equal to 1.59/10)
DPO (LSL) = 1.59 e-001
To calculate the final DPO add the DPO Score of both sides you would get value of 3.18/10 or 3.18 e-001
Now go back to the Z Table and find the Z Value for the DPO Score received.
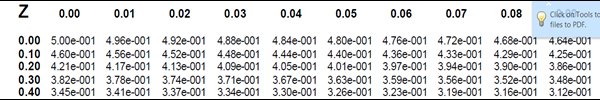 Z Table
In the pasted screen shot you can see that the nearest value of 3.18 e-001 is 3.19 e-001 which is Z Score of 0.47
Relationship between Z Score and other values used in Capability Study
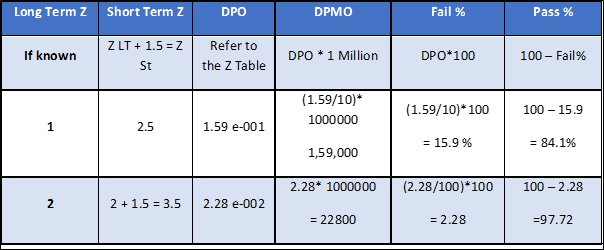
Zto DPMO Table
Calculation of DPMO
For calculation of DPMO, you should remember that DPO*1 Million
If you have known defect rate, you should look at calculating DPO. Once DPO is done, multiply that by a million to get DPMO. Let me illustrate this using a few examples.
Example 1:
While in the quality evaluation process QA audited 100 transactions each with 20 check points. Out of the several opportunities he found 32 defects. Please calculate DPMO.
Solution:
Calculating the total opportunities available: 100*20 = 2000
DPO = Defects/ Total Opportunities = 32/2000
Hence DPMO = 32/2000*1000000 = 16000


Comments (0)
Facebook Comments