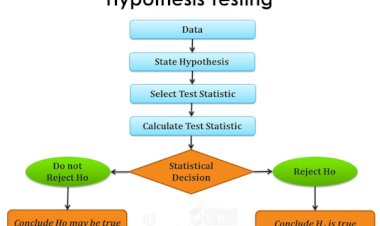
Paired T Test
Paired T test is another parametric test based on Mean and is used to make comparison between mean of two populations for continuous data
 Pankaj Kumar
Apr 24, 2019
2975
0
Pankaj Kumar
Apr 24, 2019
2975
0


Paired T test is another parametric test based on Mean and is used to make comparison between mean of two populations for continuous data.
Paired T Test
Paired T test is another parametric test based on Mean and is used to make comparison between mean of two populations. It is almost similar to 2 Sample T test; the only difference being that it is run using dependent variables. What the dependency here means is that data of one population can be paired with data of the second population or observations in one population influence the observations in the second population.
Minitab Navigation -> Stat – Basic Stats – Paired T
Comparison between Two Populations
1
Select both the fields in the first option; First variable in the “First Sample” and second variable in the “Second sample”:
2
The resultant output is like this:
Paired T-Test and CI: AHT, Post – Improvement AHT
Paired T for AHT – Post – Improvement AHT
N Mean StDev SE Mean
AHT 545 405.7 273.4 11.7
Post – Improvement AHT 545 200.9 102.4 4.4
Difference 545 204.7 296.1 12.7
95% CI for mean difference: (179.8, 229.6)
T-Test of mean difference = 0 (vs not = 0): T-Value = 16.14 P-Value = 0.000
The output gives the Count, Mean, Standard Deviation and Standard Error of Mean for both populations individually and then gives the “Difference” between both the populations. It then gives the Confidence Interval for the Mean Difference with 95% probability, T –value and the P-value.
P – P-value < 0.05 Alternate is true.i.e. Mean of first is not equal to mean of second
P-value ≤ 0.05 Null is True.i.e, Both means are equal.
Comparison with Pre-Determined values
We can also compare the two populations if we have specific figures of Sample Size, Mean and Standard Deviation available. Just select the second option and give the values. Minitab gives the resultant output similar to the one given above.
3
Other Options: There is also facility in Minitab present in the “Options” to change the inputs for Alternate Hypothesis. It has 3 options for Alternate:
a. Less Than: Gives the upper limit of the CI
b. Not Equal: Default option. Gives the CI
c. Greater Than: Gives the lower limit of the CI
These options can also be used by changing the 95% probability value of the CI and by comparing it against a target value
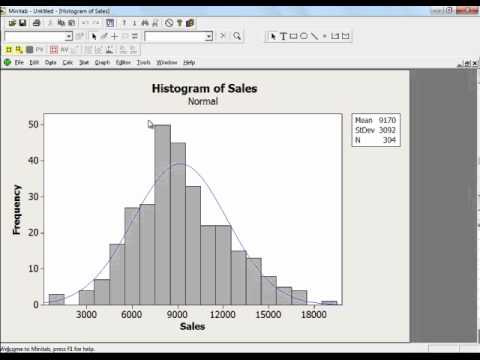
Graphical Representation
The output numerical data can also be represented in graphical manner. Minitab gives 3 options – we can use either one of them and even all of them also:
• Histogram of Differences
• Individual value plot
• Boxplot


Comments (0)
Facebook Comments