Process Capability for Defective data (Binomial Distribution)
Process Capability for Defective data is important for people doing projects in Defective data or accessing capability for defective data.
 Vinay Kumar
Apr 24, 2019
9201
0
Vinay Kumar
Apr 24, 2019
9201
0

Process Capability for Defective data (Binomial Distribution) is a great thing to know for practitioners.
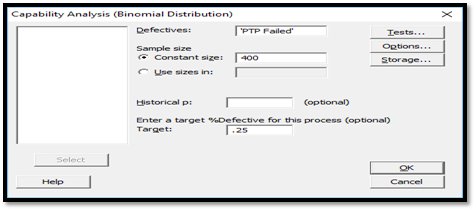
Use Capability Analysis (Binomial Distribution) to assess the capability of an in-control process when the data are from a binomial distribution . A capable process is able to produce products or services that meet specifications. Binomial capability analysis examines the proportion of defectives for each sample across samples.

Process-Capability-for-Defective-Data using Minitab
Process-Capability-for-Defective-Data using minitab
Process-Capability-for-Defective-Data3
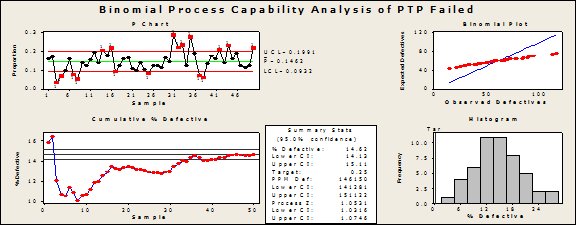
Capability Analysis – Binomial consists of four graphs and a table of results in one window. Use the four graphs to check the assumptions for a binomial capability analysis. The table of results provides summary statistics and a capability index that can help you assess process capability.
The P Chart is located in the upper left corner of the Process Capability Analysis .
Use the P chart to determine if the proportion of defectives per sample is in control . The process should be in control before you assess capability. If the process is not in control, then the capability statistics will be incorrect estimates. The P chart consists of the following:
- Plotted points, which represent the proportion of defectives for each sample
- Center line (green), which is the average proportion defective across all samples
- Control limits (red), which are located 3 s above and below the center line and provide a visual means for assessing when the process is out of control.
Examine the P charts for points located outside the control limits or other non-random patterns.
The Cumulative %Defective graph is located in the lower left corner of the Process Capability Analysis.
The cumulative %Defective graph can help you determine whether you have collected data from enough samples to have a stable estimate of the %Defective.
Ideally, this graph should show that the %Defective stabilizes after several samples. This would appear as a flattening of the plotted line.
The Rate of Defectives graph is located in the upper right corner of the Process Capability Analysis.
Use the rate of defectives plot to assess the assumption that the rate of defectives is not affected by sample size. Examine the plot to see if the %Defective is randomly distributed across sample sizes or if a pattern is present.
| Note | When your sample sizes are equal, a binomial plot will be displayed instead of the defect rate plot. The binomial plot plots the expected and observed number of defectives. You should examine your plot to see if the plotted points are in a straight line. If not, then the assumption that the data were sampled from a binomial distribution may be false. |


Comments (0)
Facebook Comments