To increase the per day average collection of payment
increase per day average collection payment in a BPO as taken up by a student for his six sigma black belt project required for his certification

Dear All,
I have made some correction in the project detail. Please share your thought what more can be done into it.
Thanks for anticipation.
to-increase-the-per-day-average-collection-of-payment
Dear All,
I am Akash Deep. I had done a project to increase the per day average collection of payment so i have described it in two pages. Please find the attached project detail on the collection of payment. And let me know that what more can be the possible area should be included or excluded in details.
Thanks for anticipation !!
Title: – To increase the per day average collection of payment
Description:
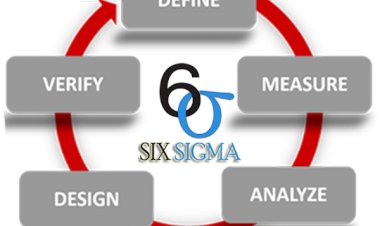
In the Pre-DMAIC phase, we had a meeting with entire stakeholder to collect the CTQ. After meeting with the stakeholder (CEO, Operation head, Team Manager) we had collected a sample i.e. VOC of each stakeholder. Since, the all stakeholder were concerned about the average collection of the payment they are receiving from the customer is very low. So, our CTQ had decided to commence the project on the improvement of the per day average collection of payment of the team leader.
In define phase, we made our project charter where we have given the business case, problem/opportunity statement, goal statement. In problem statement we have given the all numerical value i.e. Mean is 9170.44, median was 8838.63, std. dev was 391.56, and range was 18337 for the head count of 304 nos. which were affecting the business financially. And that data was provided by the client of one month duration i.e. January 2016. So, in our goal statement clearly mentioned to improve to take the target till the client expectation that to make it above 12000 which in this case becomes LSL.
After the approval of the project, the team had been decide to work on. And also their roles and responsibilities made clear to them. And we moved into the measure phase of the project.
In measure phase, we had data of average collection of the each team leader for the one month. So, here we first had to validate the data. To validate data, MSA had been conducted for the data provided. So, we conducted Gage R&R. Since we had continuous data and single sided specification so we found the z-score for single sided data and we had 0.59 sigma level as a process capability.
In the Analyze Phase, we had to find the potential factors so, we made cause & effect diagram, SIPOC, done barnstorming with the process team. We had discussion with the SMEs to seek the most contributing factor in the process. So, several factors had come out after all these activity we conducted. And the we had conducted hypothesis test to see the significant impact of each factor on collection (Y). Since the collection data was continuous metrics. So, when our factor was continuous we have conducted correlation and regression test and when the factor were in discrete then we had conducted 1 sample sign, Mann Whitney, Mood’s Median Test. In this phase several factor were tested but out of all factor four factor were had a significant impact on the collection (Y). Those factors were work (the allocated target to the team leader), average payment size (average payment collected), RPC (right party contacted not the first timer), and utilization (total collection made against the expected collection in the month).
In Improve Phase, after getting the potential factors which had significant impact on the collection (Y) are screened. To do the screening of the factors we had used independent tool called QFD to find out the actionable items against the impacting factors. The actionable items we got from this experiment were Training of the agent, preparation of the job description, checking relevant experience of the agents, skill based target, simulation test of each agent, collecting data of each customer, history of each customer, prioritization of the customer. After finding out the actionable items improvement plan are made and implemented. All this took almost 4 weeks to prepare the improvement plan. And the implantation took another four weeks of time. After one months of implementation of the improvement plan, we have then collected the improved data and then we have conducted pre and post analysis of the collection (Y) and also for the all the impacting factor’s (Xs). After checking the data whether the improvement had took place or not. Since in this case there was the improvement in the in the per day average collection of the team leader. So, we had then improved process and so we had set KRA for the internal officials and submitted to the organization.
In Control phase, we had now set the new process and implemented in the business and then again we had collected the one month data again to validate the whether the newly implemented process is working or not. So, again we had conducted controls test to see the variation and here the variation wasn’t in the process so, we made it as new standard procedure in the organization.
As, we had again checked z-score to see that till what sigma level the process is working then it came 1.44 sigma level and earlier it was 0.59 sigma level.

 Shishu Pal


Comments (0)
Facebook Comments