Getting to Know Your Process – Process Mapping
A process is just a set of activities that you give a name. This article on Getting know process - process mapping will help you understand the process.
 Vinay Kumar
Apr 24, 2019
4750
0
Vinay Kumar
Apr 24, 2019
4750
0

A process is just a set of activities that you give a name. This article on Getting know process – process mapping will help you understand the process.
Getting to Know Your Process – Process Mapping
Processes are everywhere! Making a phone call is a process, a meeting is a process, and even making tea is a process. A process is just a set of activities that you give a name. If a process consists of many activities, you may want to group them into sub-processes. Processes can be stand-alone or interact with other processes. You participate in processes every day. Using a picture to describe your process helps it easier to understand. Making this picture is what we call Process Mapping.
I start off describing what a process is and different ways to look at them. Next, I explain how to map processes. Finally, I discuss different types of process maps, save your work and some useful software tools.
Okay, So What Is A Process?
A process is a set of activities by an individual or group of people that produces something using materials and information to begin with. Normally, you want the process to produce something of value to whoever receives it. Each process has a starting point and ends with the delivery of something to the receiver. You can decide where it starts and ends.
In Six Sigma we call the materials and information “inputs” to the process. The process then does something with these inputs and produces something. This something we call the “output(s)”. The recipient of the output is called the Customer. Of course, you can have multiple Customers. So, guess what we call the people who provide the input(s): you got it – the Supplier(s).
It’s Just The Way You Look At It
If you ask different people about a process, you get slightly to very different descriptions of the process. First of all, you can describe a process the way you think the process works. You can also describe the process in the way you think it should work. Taking an ideal world as the basis allows you describe the process in the way you think it could be. Finally, you can observe the process and see what it really is.
Normally, when talking to people you will get a combination of what they think it is, what it really is and what is should be – very few people work and live in an ideal world.
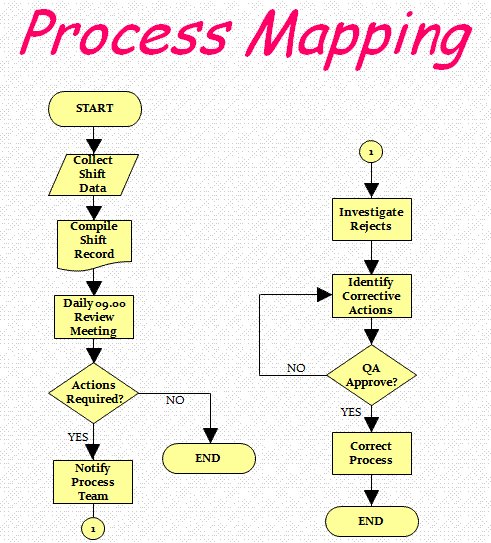
In order to show this in picture or Process Map, first let me introduce to the fist basic element of a Process Map. Note that you can pick any symbol you want, but these are commonly used.
A rectangle is used to describe an activity within the process. This is called a process step. In it you write down the activity starting with an action verb.
A diamond shape is used to describe a decision point in the process. The question always results in a yes or no answer.
A rectangle with nice round corners is used to show the start or end of a process. Write start or end in it.
For those of you who are familiar with Flow Charts, these elements or symbols should be very familiar. Flow Charts were used in the beginning of computer programming to describe the start and end of a computer program, the different things it was supposed to do and any decisions to take to determine to do one thing or the other.
So, now that we have some symbols to describe a process, let’s use them to illustrate the difference of looking at processes in from the different viewpoints.
However, Figure 2: What It Really Is – looks very different. It still has 5 steps, but one step is only executed and the other step never is, depending on the decision taken.
What’s The Point Of All Of This?
The upshot of all of this is that you need to understand what you are looking at. More over, if you want to make any changes to the process, it does not make very much sense to change what you think it is nor what is should be as they only exist in our minds. The only process you are really interested in is what it really is.
How Do I Create A Process Map?
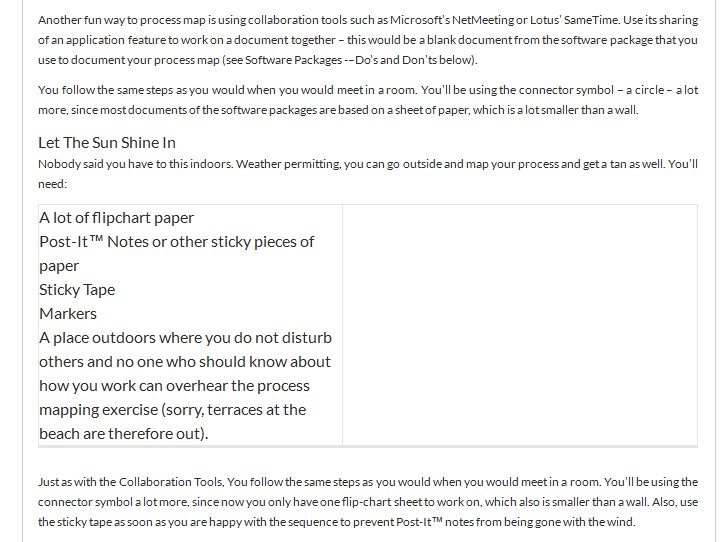
Process Mapping is actually very easy and a lot of fun! You can do it over the phone, using collaboration tools like Microsoft’s NetMeeting or Lotus SameTime, in a room, or outside in the sun with a flip chart and some chairs. It really depends on the complexity, detail and location of the people participating to figure out where to this.
Who Should Be There?
It may sound silly, but you need the people who actually do it. Sometimes people attend who are available at that moment, but really don’t do the activities in their day-to-day job, or used to do it. Things change all the time and only the people who actually carry out the activities can tell you what is done on a day-to-day basis. Does this mean the process varies over time with different people coming in and off to do other things? It certainly does. Especially, if the process has never been documented.
Processes tend to vary less over time, if they are documented and audited on a regular basis. Companies who are ISO 9000 accredited for instance are better at limiting changes than those who do not have their processes documented.
Let’s Get Together
If you can get the people together in one place, you’ll need the following things:
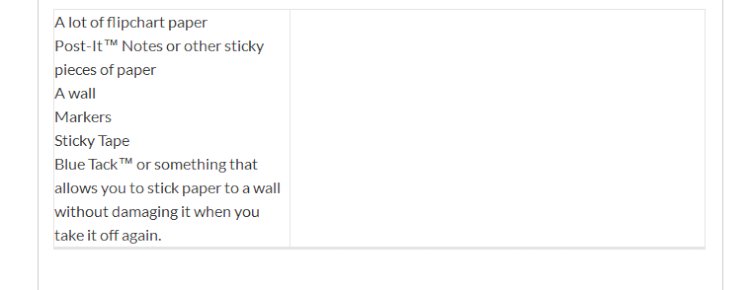
First, take anywhere between 5-7 sheets of flipchart paper and stick them to the wall. Next, you draw a start/end symbol – the rectangle with nice round corners – on a Post-It™ note and write “start” in it. You place it in the upper left-hand corner of the sheets on the wall.
Next, the first person that does something writes what it is he/she does, how long it takes and the elapsed time on a Post-It™ note and sticks it below the start symbol. See “Do I Need To Map Down To The Level Of Take Pen From Drawer” for an explanation of why these times are added.
This is repeated until you reach a decision or someone else takes over. You can show the decision using the diamond shape and then you need to follow two routes – one for a “yes” decision” and the other for the “no” decision. If you have three or more choices, you need to break each choice down into a yes/no decision, e.g. is the traffic light it red? Yes, go to the stop vehicle step. No, is the light amber? Yes, go to “can I stop without causing an accident” question. So the light is not orange, is it green? Yes, go to the continue driving box. Not green? Go to the “proceed very slowly” box.
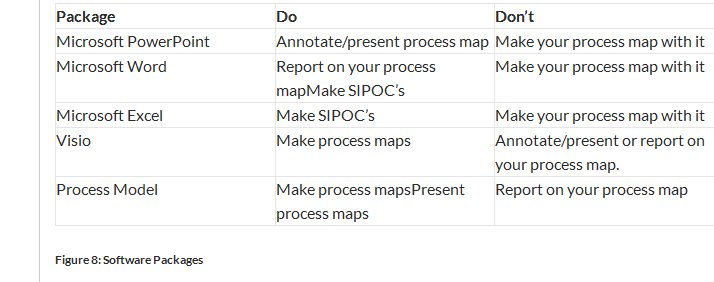
Basically, you keep this up until you come to the box where the output is given to the customer (and he accepts it of course). Then, use the sticky tape to tape the Post-It™ notes to the flipchart paper before you take them from the wall. As a courtesy, you may want to clean up the room as well. When back at your desk, document the process in a software package designed for it (see Software Packages -–Do’s and Don’ts below).
Help! I Am Running Out Of Room On The Paper
Not to worry, the folks who thought of the symbols also came up with a connector symbol. This allows you to connect one part of the process to another part on the same or another piece of paper. This symbol is a circle and you put a letter – or other identifier – in it. The letter or identifier helps if you need to use more than 1 connector.
Do I Need To Map Down To The Level Of Take Pen From Drawer?
It depends, but normally no. As described above, we wrote down the time it takes to do an activity – the so-called applied time – and the elapsed time. By the way, the elapsed time is the difference between the earliest time you could start on the activity and the moment it is handed of to the next activity or the customer.
If the elapsed time and the applied time are of the same order of magnitude, you don’t have to detail the map further. For example, issue Employee Badge is the activity. The applied time is 5 minutes, but the elapsed time is 3 days. This indicates there is either a time buffer – nobody around to do it – or it is a process in it self (get form, fill out, get authorization, hand form to issuer, check form, create badge, sign form and issue badge). The activity is really a process in itself, which we call a sub-process.
If only the output of the sub-process – in this case the badge – is relevant, you document it as a sub-process without detailing it. If it contains a critical step – i.e. the sub-process causes something else in the overall process to go wrong – you would want to detail it. The best way is to document it as a separate process, and show it as a sub-process in the one you started working on. The symbol for a sub-process is:
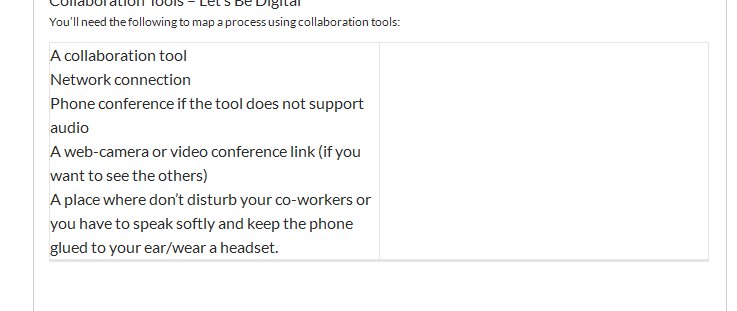
Collaboration Tools – Let’s Be Digital
You’ll need the following to map a process using collaboration tools:

Linear, Functional And Other Forms Of Process Maps
Yep, there are different types of Process Maps. The most popular ones are the linear process map and functional process maps.
Let’s Talk Straight: The Linear Process Map
A linear process map shows the sequence of events, but not who actually carries out each activity. Let’s have a look at the process which takes place when a visitor to your office arrives.
Fig4_2
Figure 3: Linear Process Map Of Visitor Arriving
Take It A Step Further: The Functional Process Map
Functional process maps are almost identical to linear process maps, except that you use “rows” for each person involved with the process. Before you place the start symbol, you have a column where you write down each of roles of the persons involved with the process. It is a good idea to draw horizontal dotted lines between each of them. This is what the functional process map for what happens when a visitor arrives at your office:
Figure 5: Functional Process Map for Visitor Arrival
Fig4
Let Your Imagination Run Wild: Other Forms Of Process Maps
Within the group that you work with, you can basically agree on any form of mapping your process. You can make hierarchical process maps with different levels, physical process maps which shows the movements of people and goods, you can use cartoon characters or graphics, colors and some software packages allows complete animations.
However, there are some things to bear in mind:
Be sure that everyone understands how to read your map. This is no different than using a ordinary map. A map of Tokyo with Japanese symbols and legends is useful if you can read Japanese.
The other thing is to ensure that everyone can work with your map. If you use an exotic software package that no one else has, nobody except you can view it and make changes. This sometimes also applies to different versions of the same software package.
Finally, remember that not everyone has the same equipment as you do. Their computer has to powerful enough to show the animations and if you want a hard copy, colors do not always come out the way you thought they would.
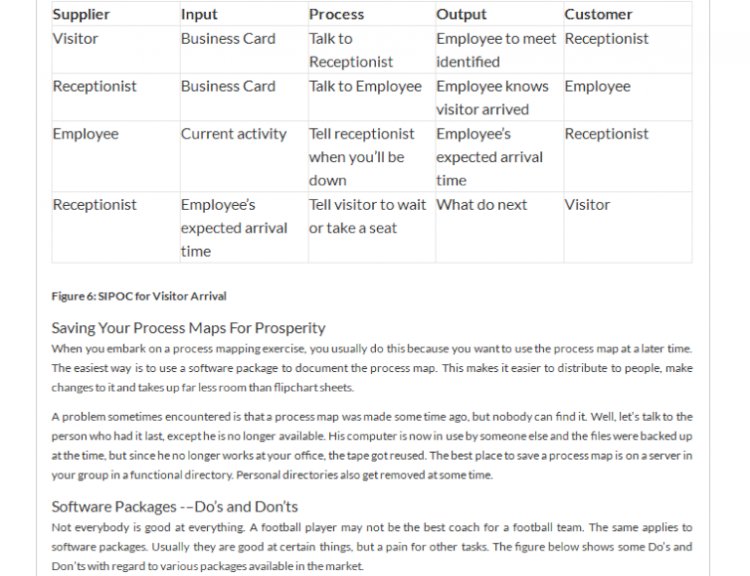
Hey, What About This SIPOC Thing I Heard About!
Yes, you are right. A special form of a process maps are SIPOC’s. SIPOC stands for Suppliers, Inputs, Process, Outputs and Customers.
Similar to a Functional Process Map, you have rows but also columns. The columns are labeled: “Supplier”, “Input”, “Process”, “Output” and “Customer”. For each process, and subsequently sub-processes you not only right down the process, sub-process and process steps, but also the inputs and outputs of the process and the suppliers and customers for these inputs and outputs. Let’s look at the visitor arrival process again.


Comments (0)
Facebook Comments