Chi Square Calculation
Chi Square is one of the most important statistical tests used while doing hypothesis in your project when the data is in discrete.
 Vinay Kumar
Apr 24, 2019
14165
0
Vinay Kumar
Apr 24, 2019
14165
0

Chi Square is one of the most important statistical tests used while doing hypothesis in your project when the data is in discrete.
Chi Square Calculation
Chi Square = ∑(O-E)2/E
Where “O” is the Observed Frequency and
“E” is the expected Frequency
The observed frequencies are the frequencies obtained from the observation, which are sample frequencies.
The expected frequencies are the calculated frequencies or
Chi Square = ∑(Fo-Fe)2/Fe
Where “Fo” is observed frequency and
“Fe” is expected frequency
Step 1 – Calculate the expected frequencies.
Step 2 – Take the difference between observed and expected frequencies and obtain the squares of these differences (O-E)2.
Step 3 – Divide the values obtained in “Step 2” by the respective expected frequency “E” and add all the values to get the value according to the formula by
Chi Square = ∑(Fo-Fe)2/Fe
The Chi-square curve will be on the positive side of the X-Axis because the Chi-Square values are always positive.
Chi-Square Distribution
The square of a standard normal variate (A variable quantity that is random) is called a Chi-Square variate with 1 degree of freedom (V=1), that is if “x” variable is normally distributed with a mean “μ´and standard deviation “б” then (X- μ)/ б is a Chi-Square variate with “V” equal to 1.
For example:
If X1, X2…….Xn are “n” are independent random variables following the normal distribution with mean “μ” and Std. dev. “std. dev” respectively then the Chi-Square variate will be:
Chi Square = (X1-mean)2/Standard Deviation + = (X2-mean)2/Standard Deviation + = (Xn-mean)2/Standard Deviation.
It is the sum of squares of “n” independent standard normal variates, following the Chi-Square distribution with “n” degree of freedom.
Tests for Independence of Attributes
In the test for independence, the Ho is that the row and column variables are independent of each other. The following are properties of test for independence.
Data are the observed frequencies.
The data is arranged in the form of contingency table.
The degree of freedom “v” can be calculated as:
V = (Number of row – 1)*(Number of Columns -1). Where “V” is the degree of freedom.
The expected value “E” is computed by taking the row total, multiplying it with the column total and dividing by grand total.
E = (Row Total * Column Total)/Grand total
Degree of Freedom for a contingency table with three rows and two columns.
V = (# of rows-1)* (# of columns -1) = (3-1)*(2-1) = 2*1=2
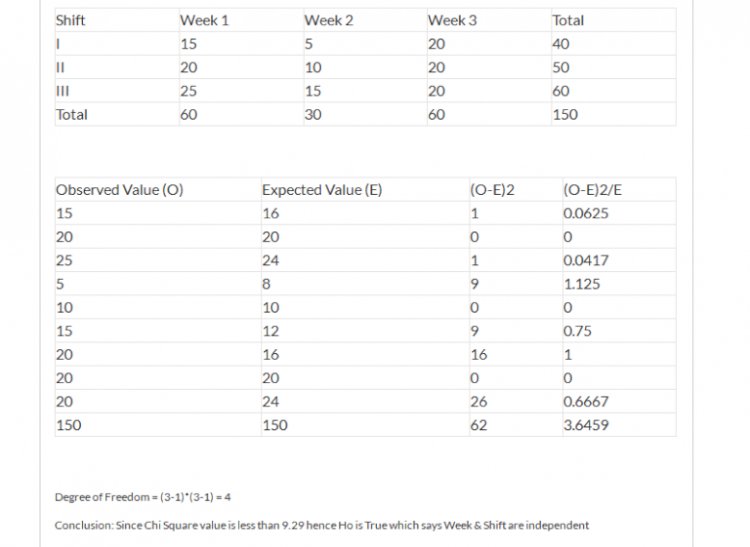
Production in three shifts and # of defective goods in three weeks Test at 5 level of significance whether weeks and shifts are independent.


Comments (0)
Facebook Comments